Gabriel Velez.
← All cases ↗
Product · Adoption · AI-assisted development

From Excel macros to a logistics platform

Earning trust with one vehicle. Supporting operations. Building the next stage.

CASE 0220 → 5 min

Approximate time per trip settlement

THE JOURNEY IN IMAGES

One operation.
Three stages.

Explore each stage and enlarge the images for detail. Project images shown with test data.

01The initial operationPaper forms and visual tracking

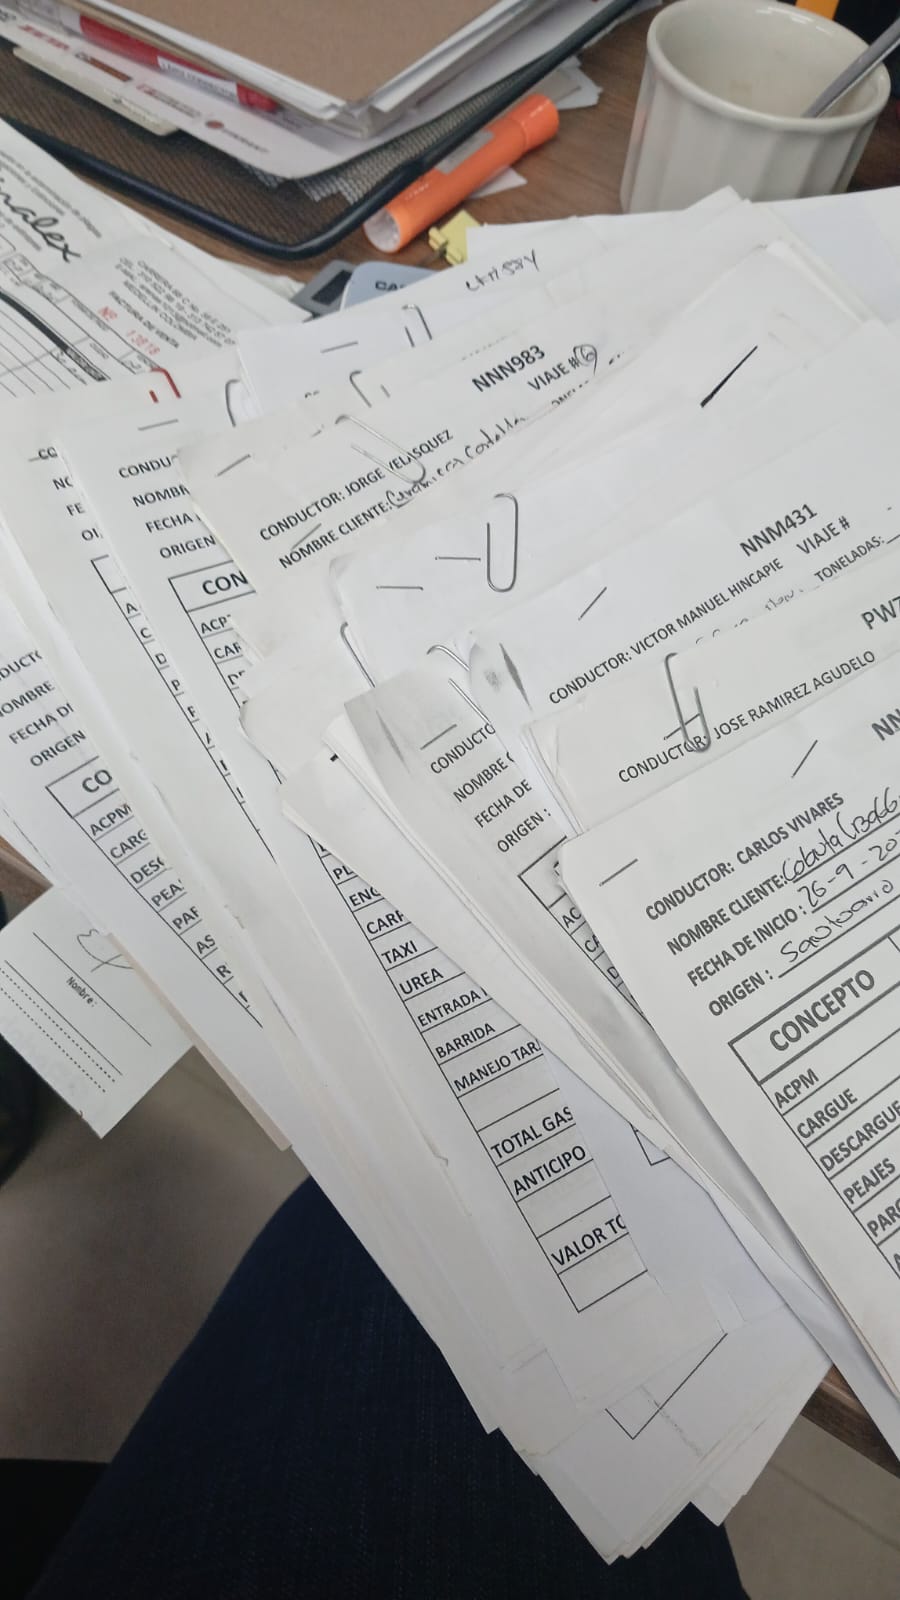
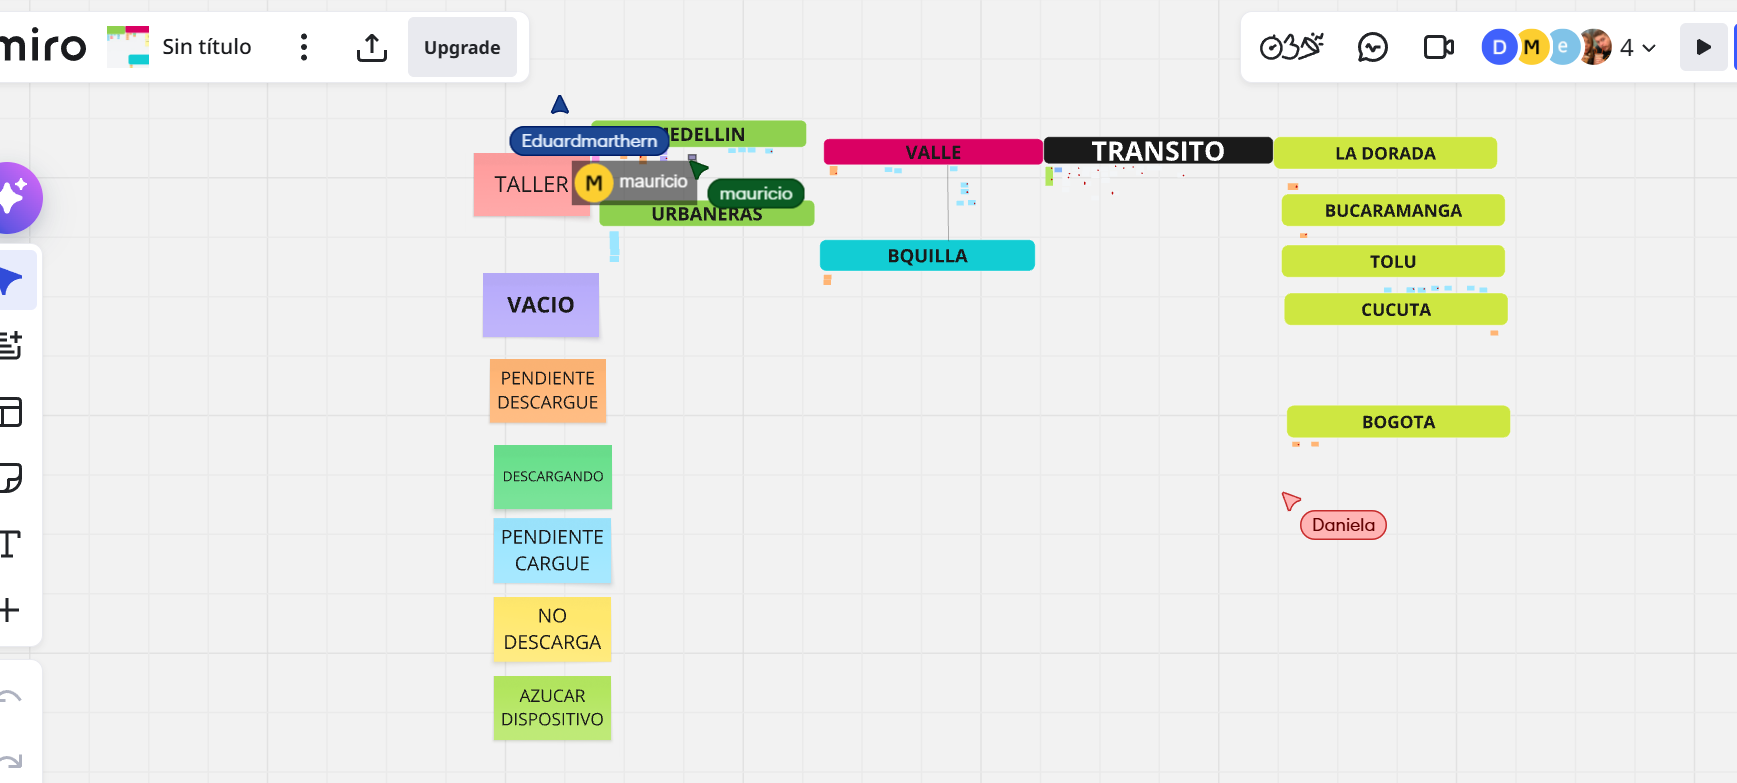
Paper forms held the information for each trip. The Miro board organised tracking by city and status. They were separate parts of the operation.

Manual forms for recording trips and expenses.Enlarge image ↗
Manual forms for recording trips and expenses.Test data
Previous Miro board: cities and operational statuses.Enlarge image ↗
Previous Miro board: cities and operational statuses.Test data
02The Excel pilotA small trial that earned trust

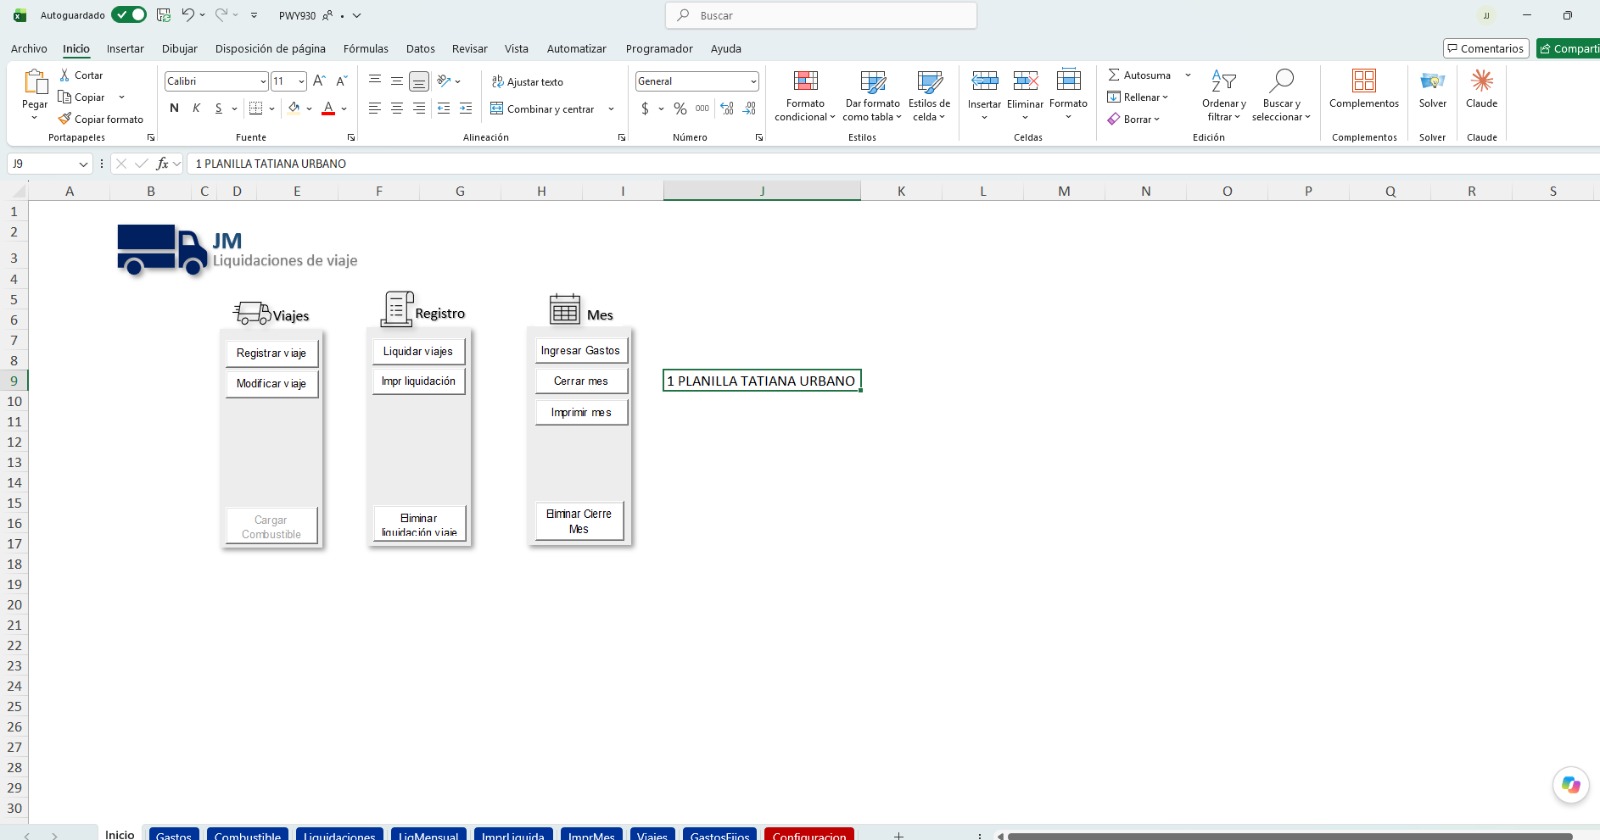
I proposed validating the complete process with one vehicle. I defined and built the pilot, put it into operation and supported its use. The Excel solution supported operations for three years.

20 → 5 minApproximate time per settlement observed during the Excel pilot.
Pilot home screen: trip registration, settlements and monthly closing.Enlarge image ↗
Pilot home screen: trip registration, settlements and monthly closing.Test data
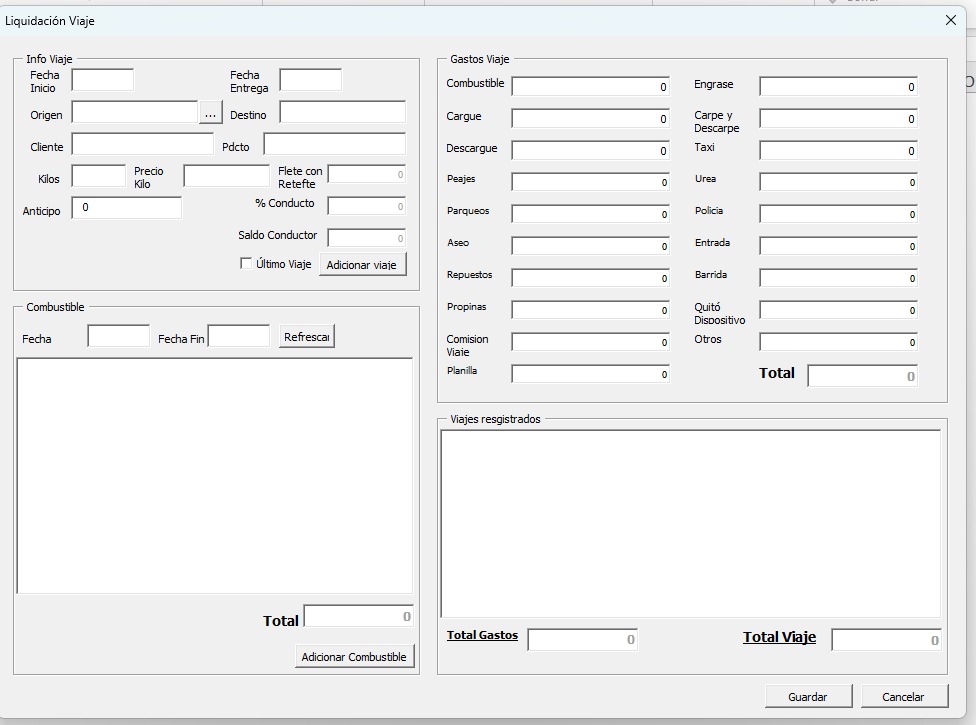
Settlement form: trip information, fuel and expenses.Enlarge image ↗
Settlement form: trip information, fuel and expenses.Test data
03The current platformConnect operations and business information

I continued defining the product and architecture and developing it with AI agents. These views show the scope of the solution; currently, two of its five modules are in controlled production.

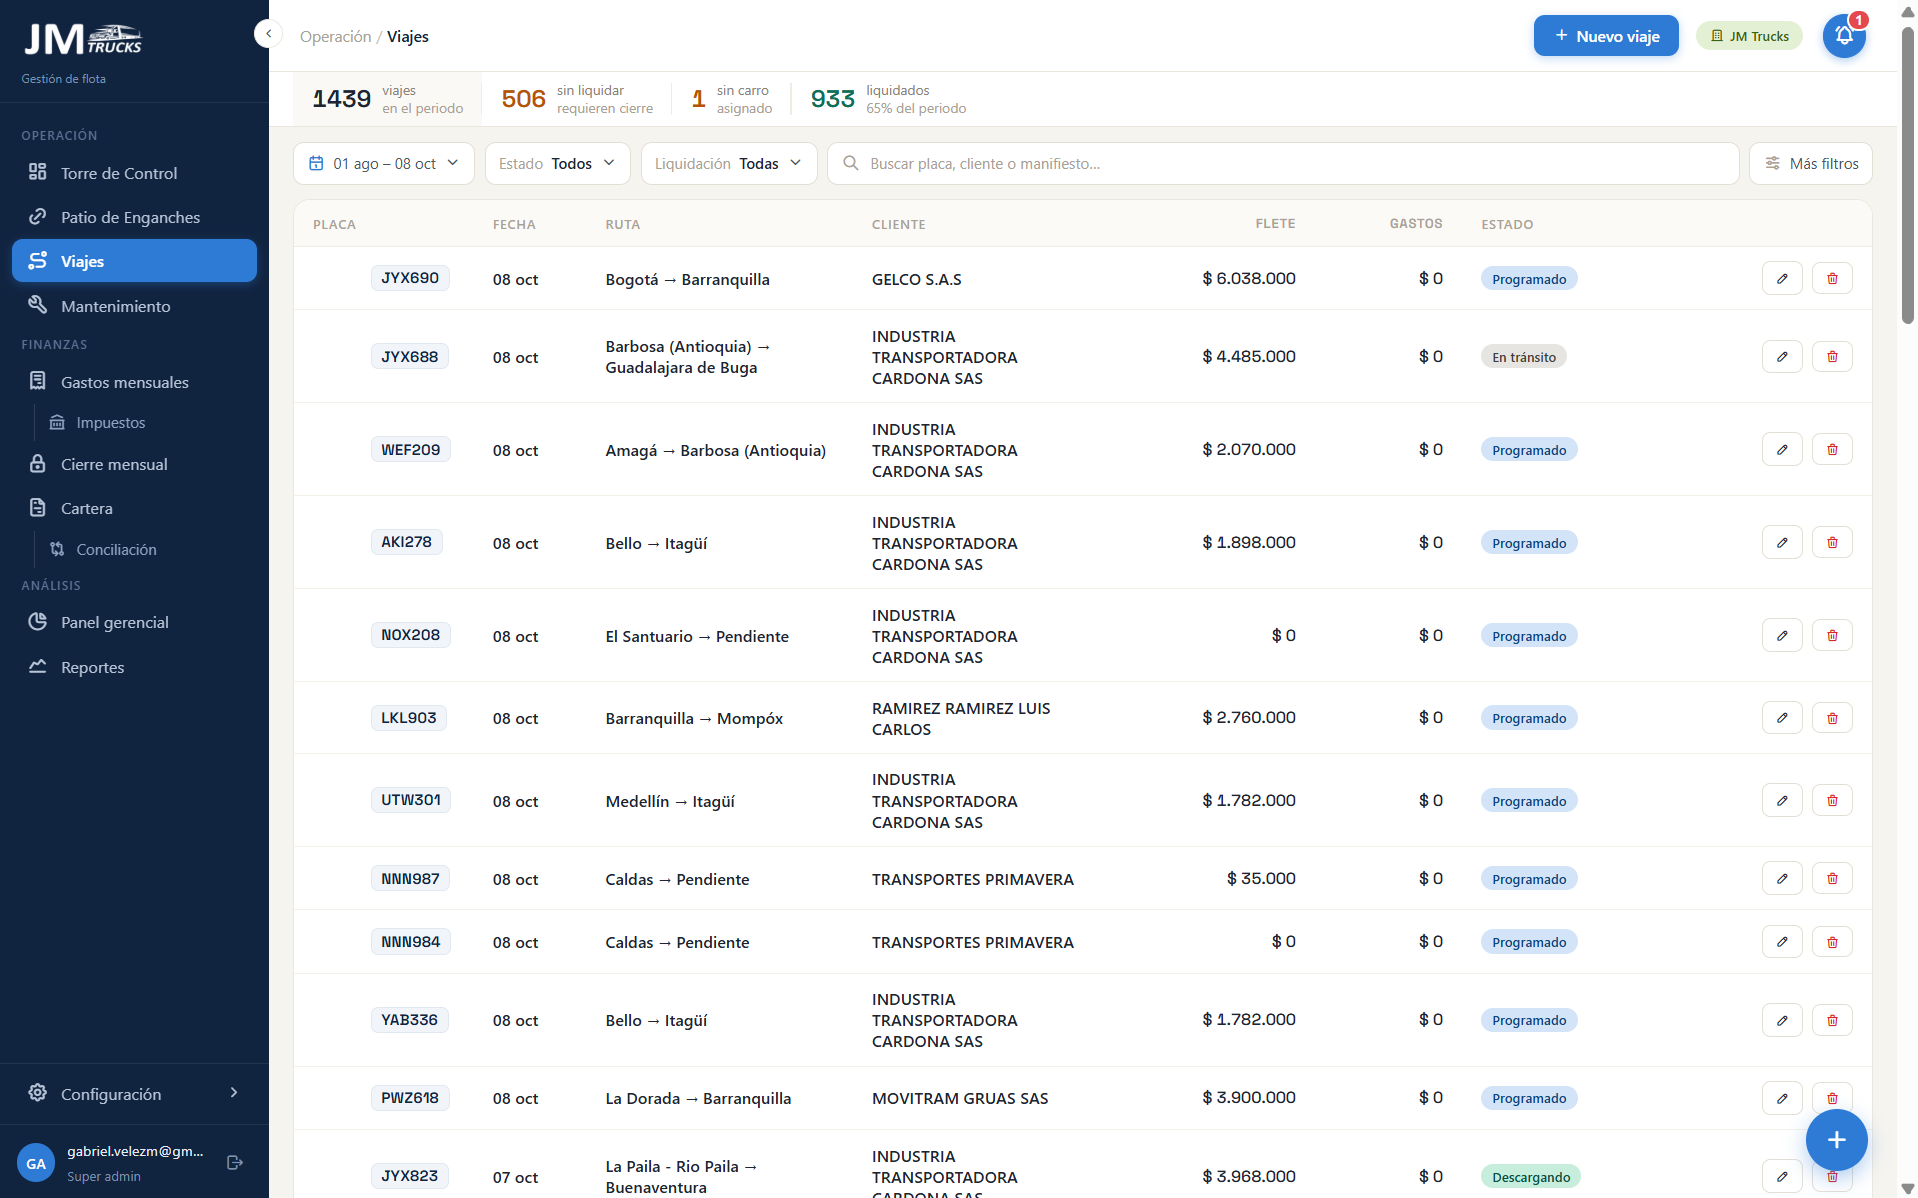
Trip management: routes, customers, settlement and statuses in one view.Enlarge image ↗
Trip management: routes, customers, settlement and statuses in one view.Test data
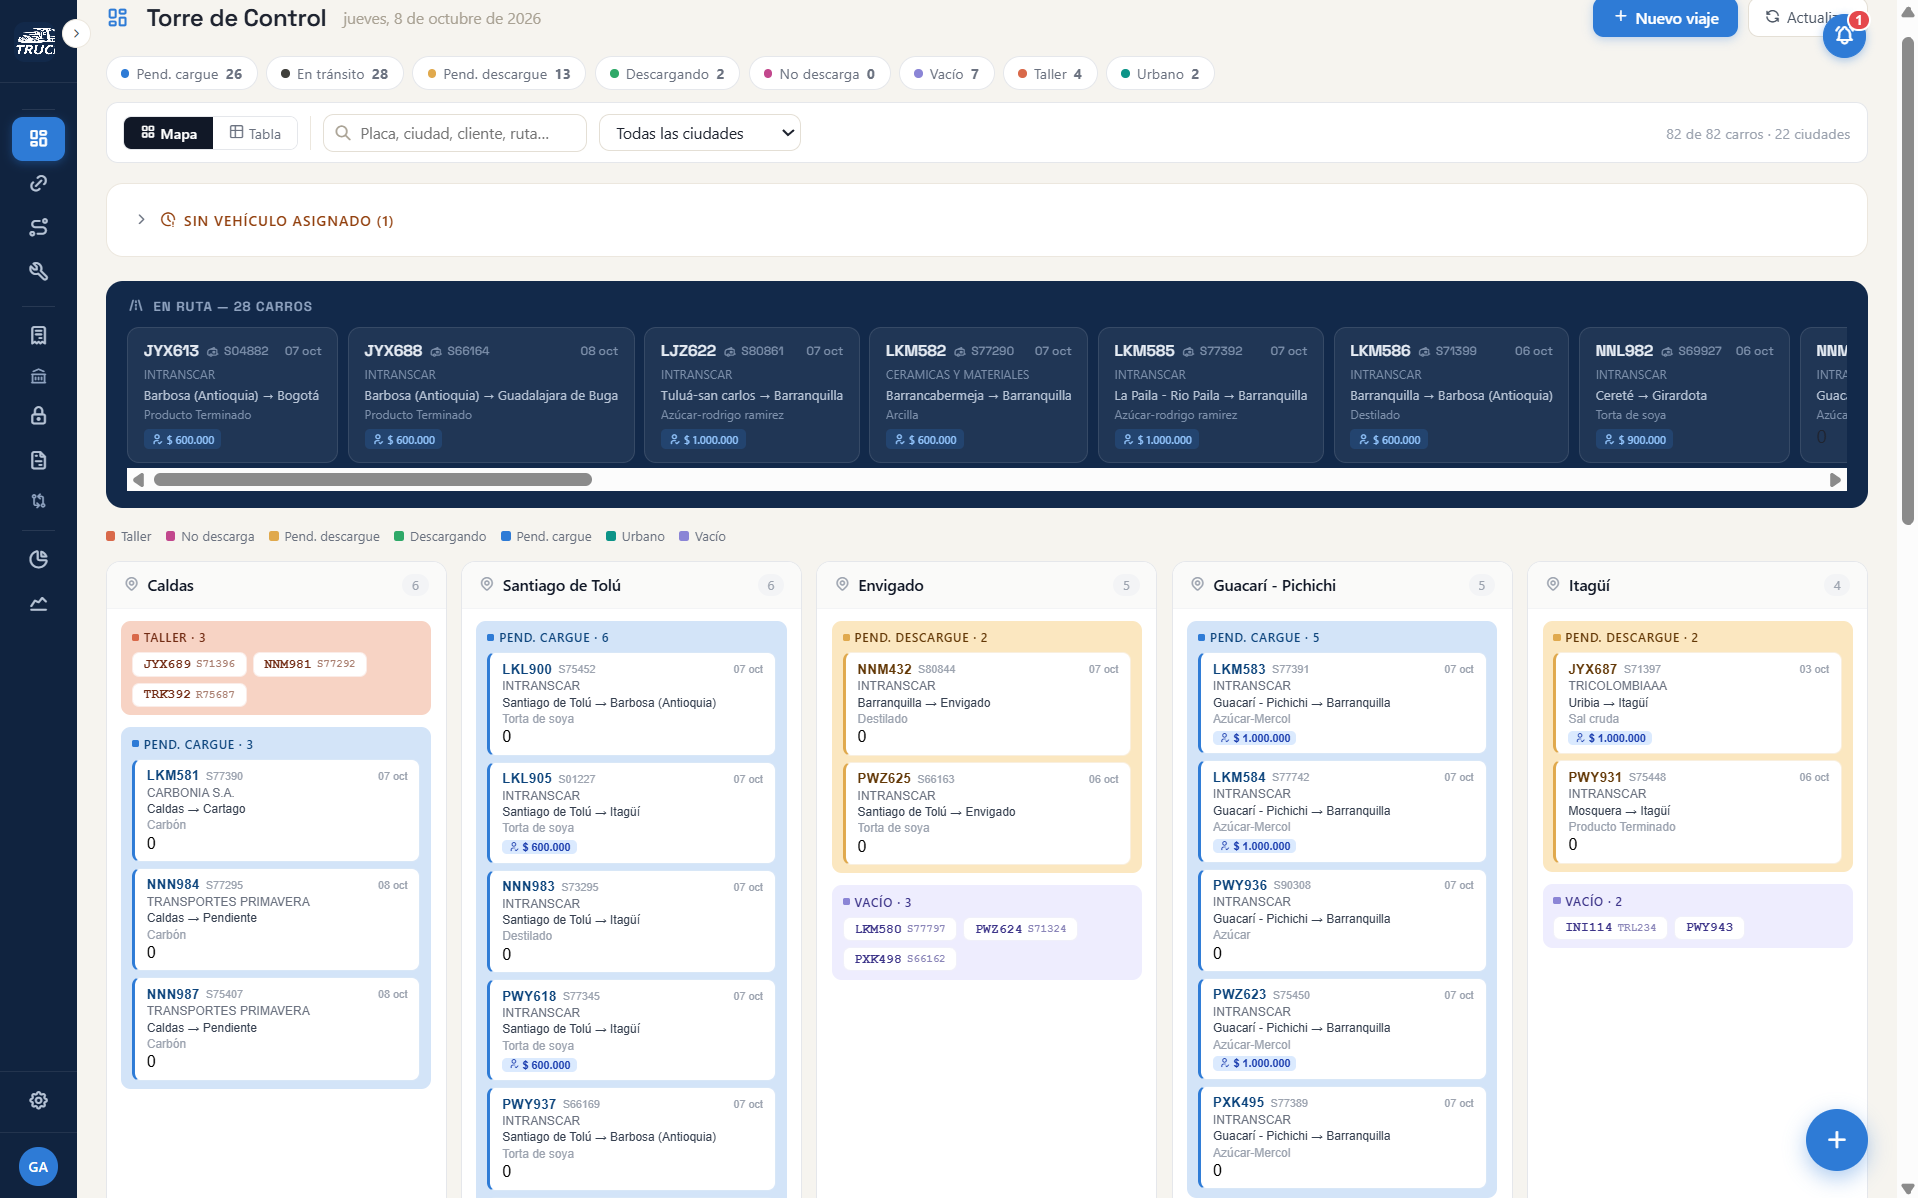
Control Tower: fleet organisation by city and operational status.Enlarge image ↗
Control Tower: fleet organisation by city and operational status.Test data
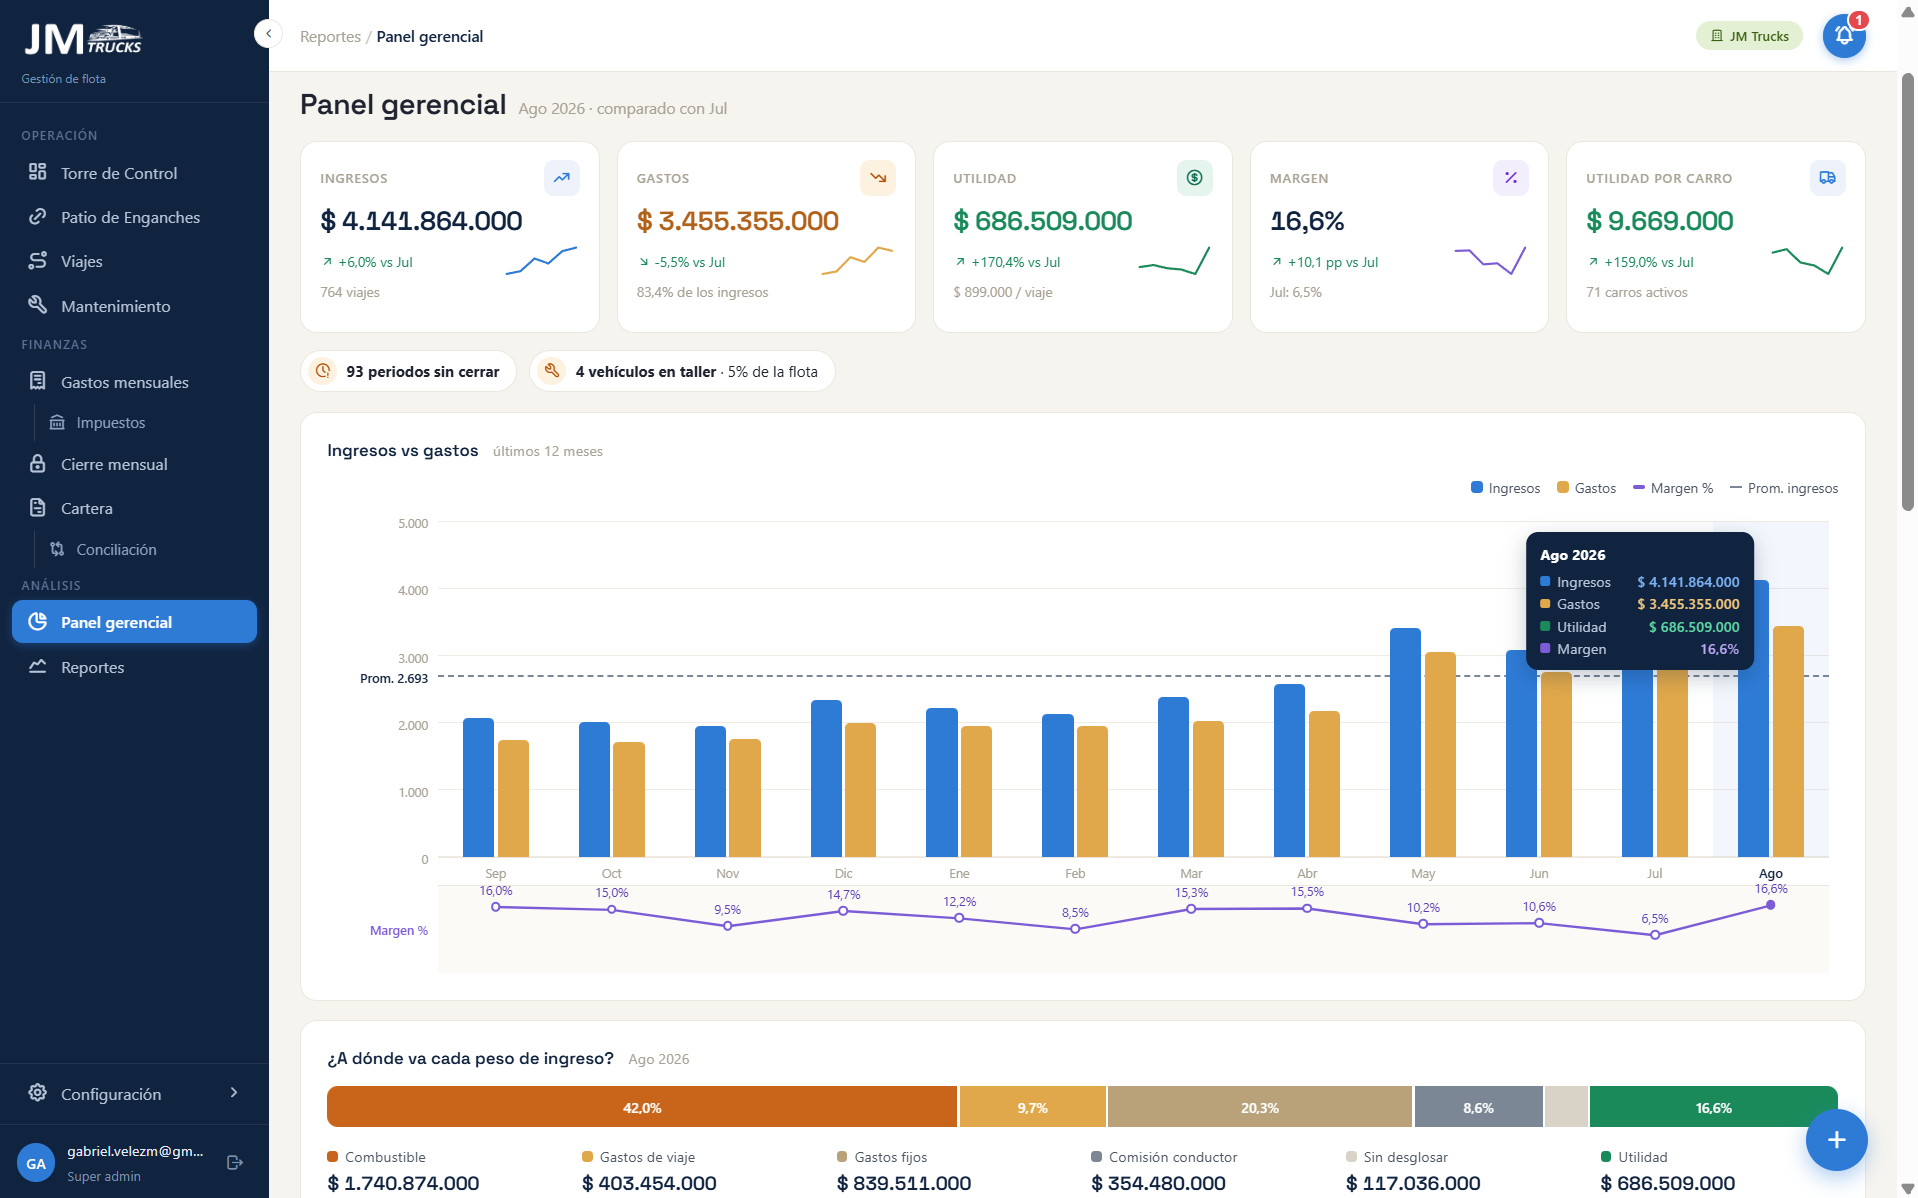
Management dashboard: revenue, expenses and margin for business analysis.Enlarge image ↗
Management dashboard: revenue, expenses and margin for business analysis.Test data

Figures visible in the screenshots are test data and do not measure the project’s impact.

Fragmented operations

The company settled trips using individual spreadsheets, calculations and manual transcription. Information was scattered, and investigating an error was difficult. Monthly closings compounded the workload.

Start with one vehicle

My first challenge was getting management to try an alternative. I proposed demonstrating the full process with one vehicle, covering both trip settlements and its monthly closing.

A pilot that supported three years of operations

I defined and developed the Excel pilot, deployed it and supported its initial use. Based on observed times, a trip settlement went from around twenty minutes to approximately five. The pilot supported operations for three years.

From proposal to implementation

When circumstances prevented a broader proposal from moving ahead, I continued designing and building. I defined the product, architecture and technology choices around the company’s needs and financial capacity.

The current stage

Today I develop the platform with assistance from AI agents. I also own their working rules, documentation, continuous integration, deployments and operational support. The new solution expands into fleet management, receivables, maintenance and management reporting. Two of its five modules are currently in controlled production.

THE KEY DECISION

Start with a small trial that lets the customer see the value and builds trust for the next step.

RESULT / PROGRESS

The pilot accelerated trip settlements and supported monthly closings. The new platform expands the operational scope.

THE NEXT CONVERSATION

What challenge
are you working on?

If your team needs to understand a problem, weigh alternatives or turn an initiative into reality, I’d like to hear the context.